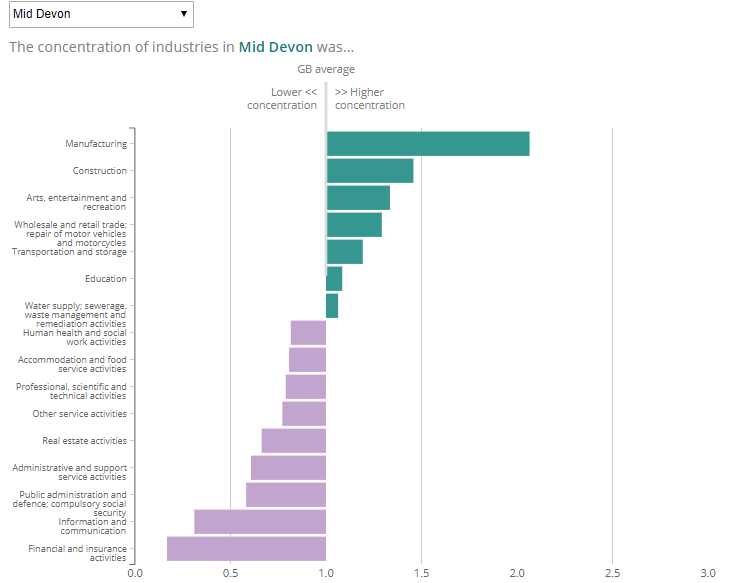
 The ONS has produced a new LMI tool which looks at the concentration of particular industries in areas at district level around the UK. The interactive chart shows whether an area has a higher share of jobs in a particular industry than the national average, lower than average or the same; this could be particularly useful for highlighting clusters of industries or particular skills needs.
This open source tool which can also be embedded into your own website using a piece of coding, is part of a suite of visual tools plus a narrative snapshot which can help to provide insights into the future of the UK post-Brexit and are located on the Visual.ONS website.
